Drowning in Data
Lots of data. No clear answers. Sound familiar?
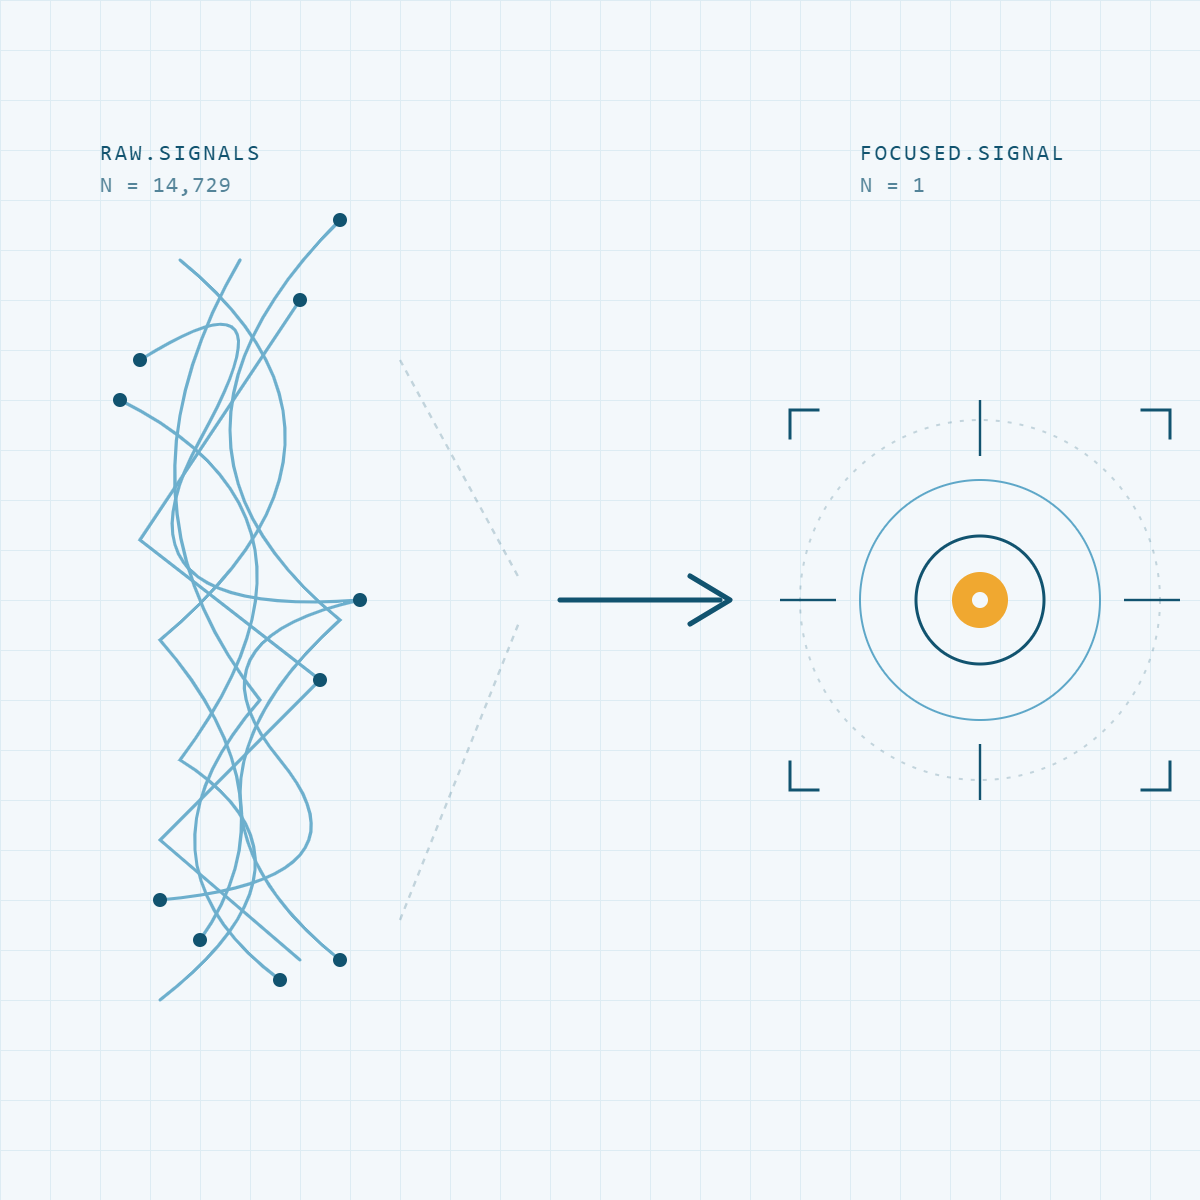
Missing the Why
You can see the numbers. But not what’s driving them.
Disconnected Systems
Your systems are all talking. Just not to each other.
Reacting vs. Anticipating
Still explaining last month instead of preparing for next?
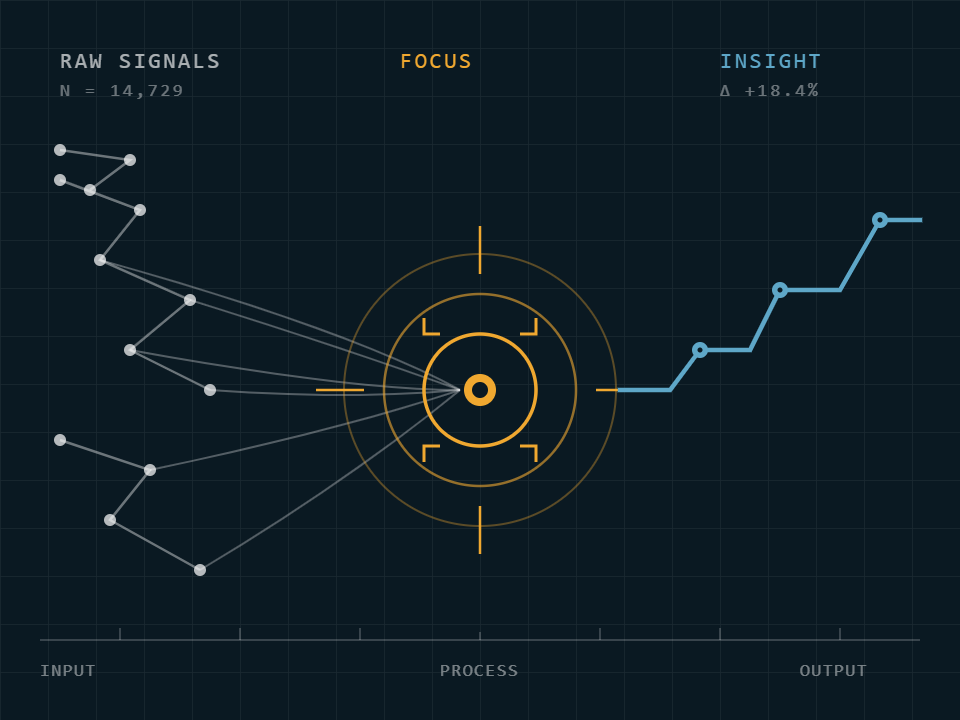
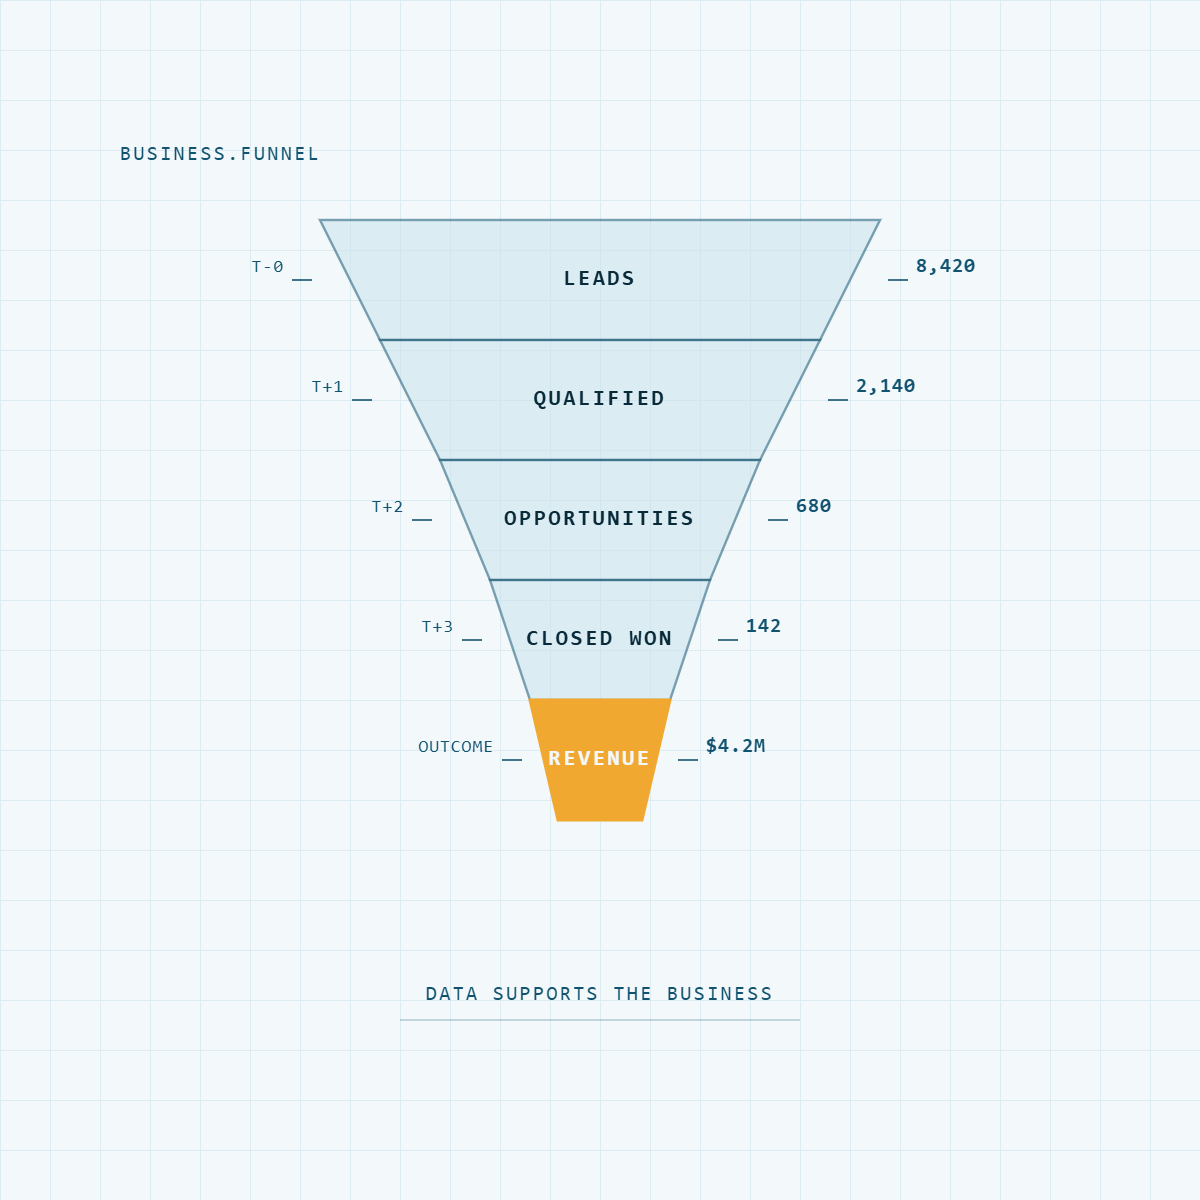
THE FOCUS PLATFORM IN ACTION
Most data tools show you what happened. We built the Focus Platform so our team could show you what it means and what to do about it.
We Love Complexity
Multi-system. Multi-location. Messy data. The bigger the mess, the bigger the opportunity.
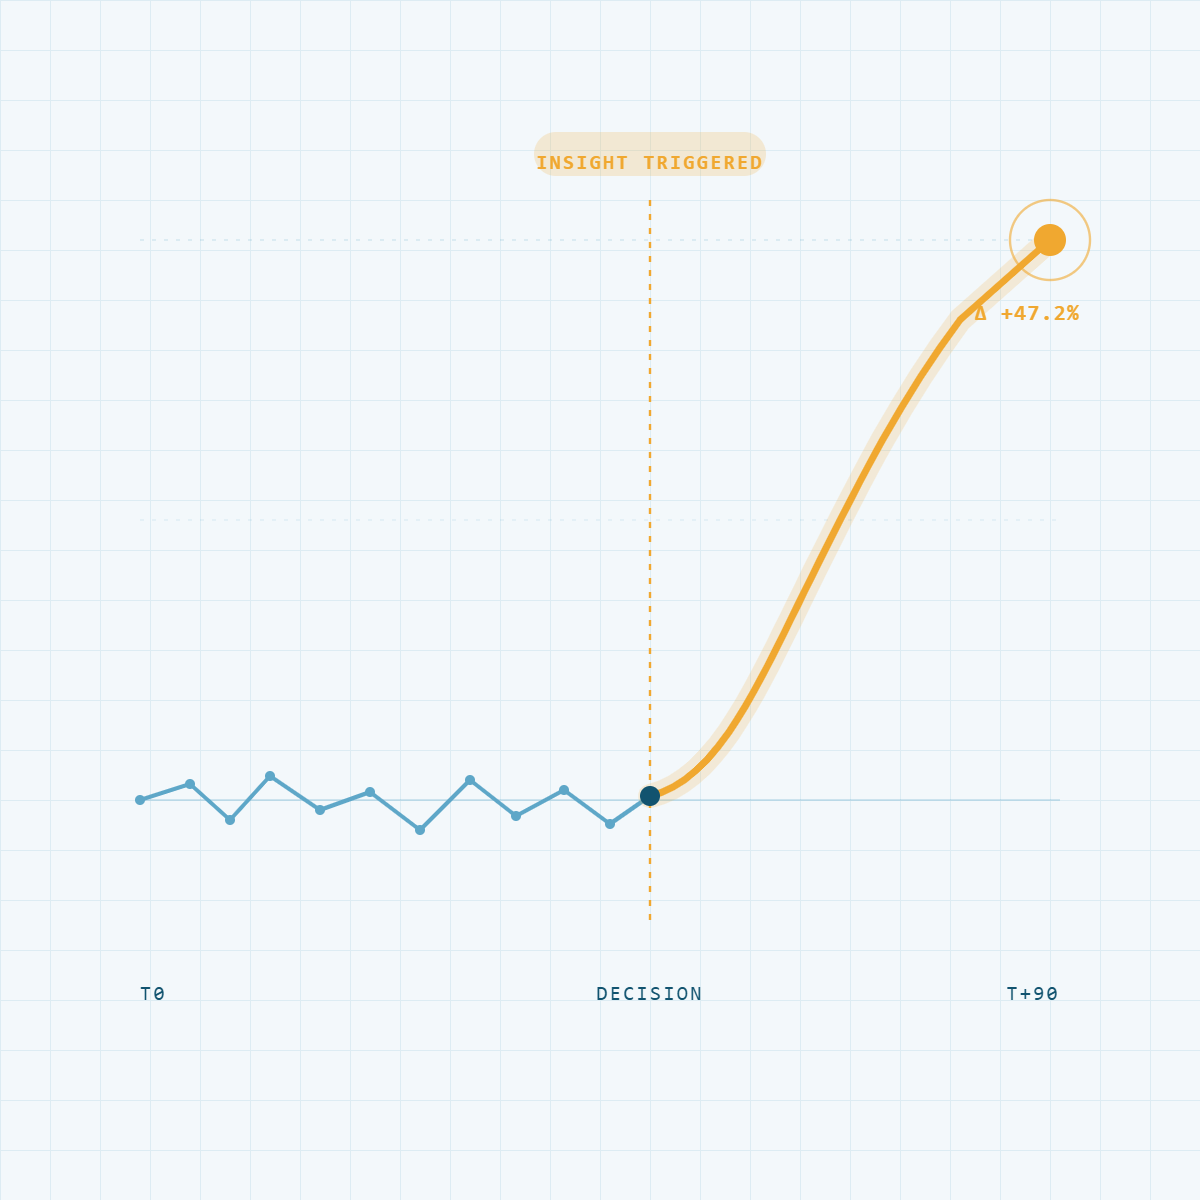
We Move What Matters
Good data informs decisions. The right insight triggers the ones that change everything.
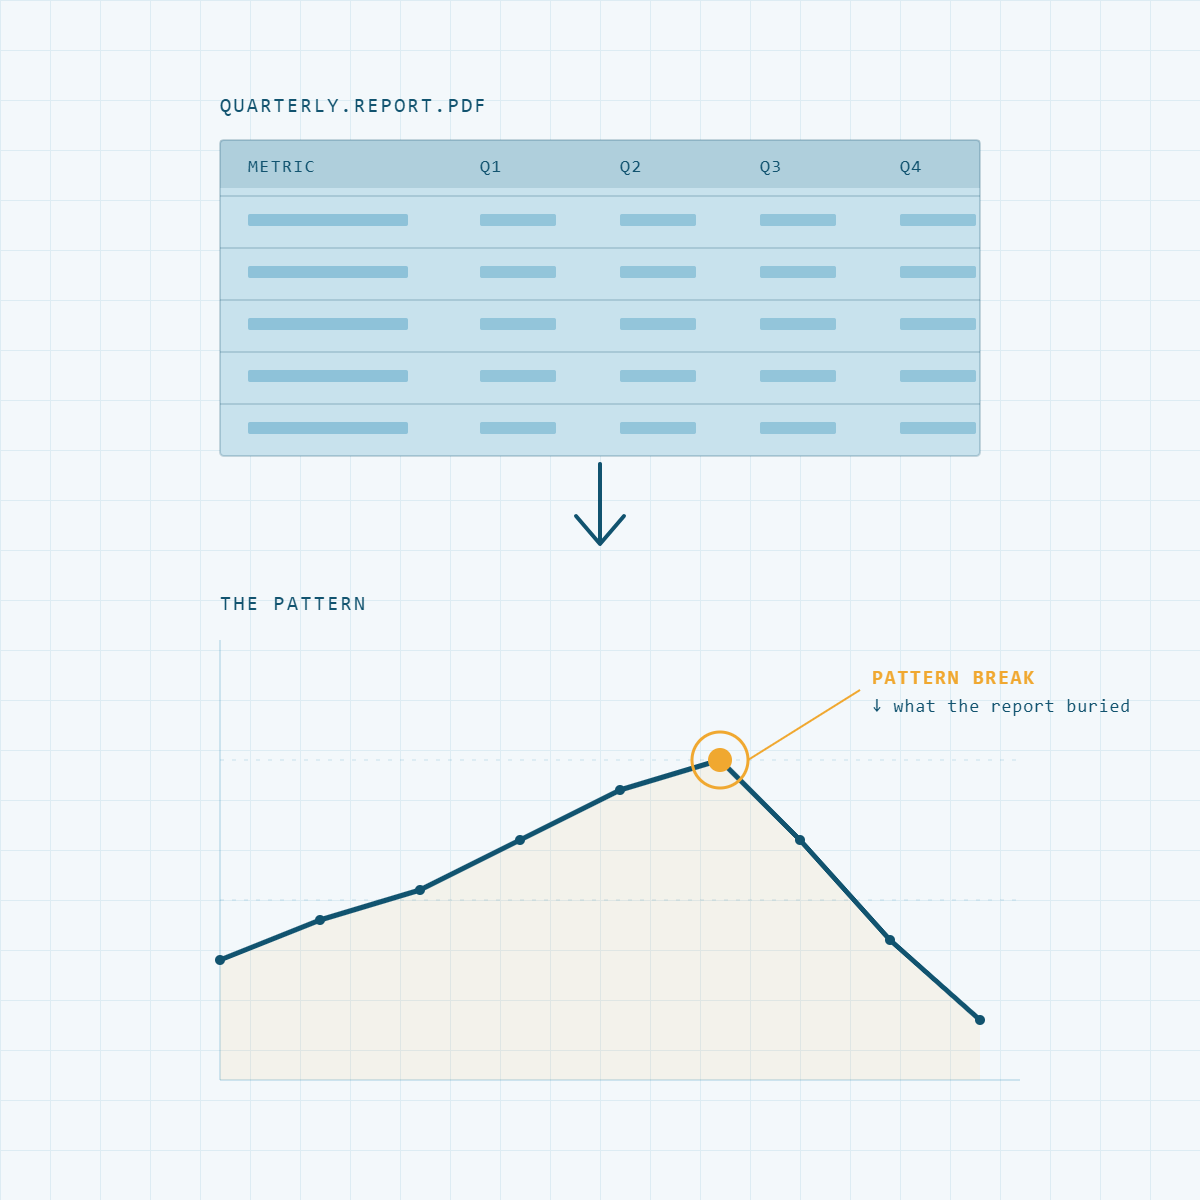
The Insight, Not the Report
We find the trend, the pattern, the anomaly that changes how you compete. You shouldn’t have to dig for it.
We Speak Business First
Data without business context is just noise. We understand your business before your data.
WHAT COULD YOUR DATA UNLOCK?
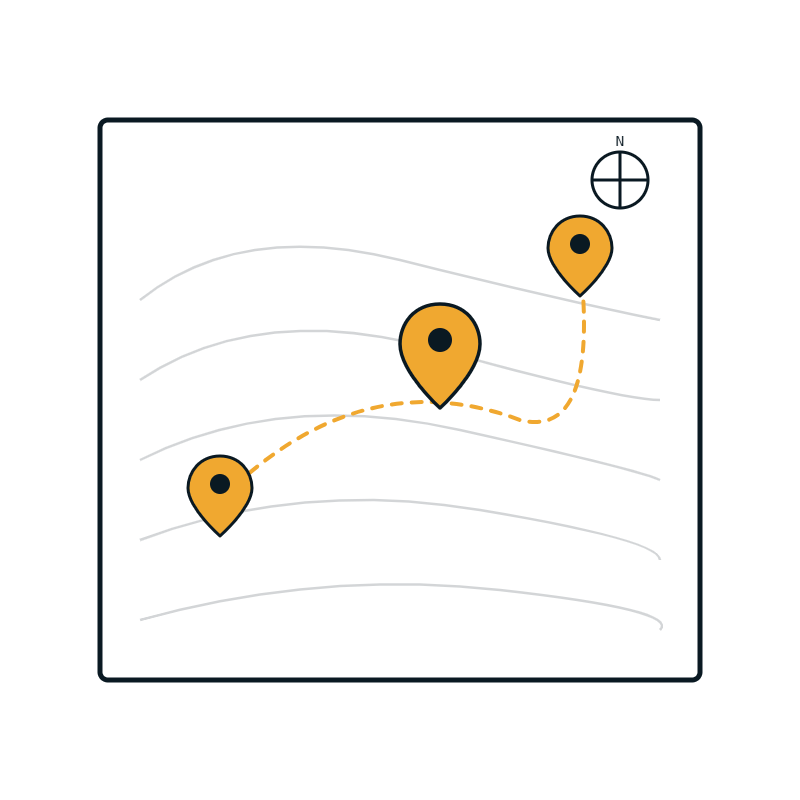
START WITH THE FOCUS AUDIT
The kind of data strategy that used to cost seven figures now starts at $10,000. We assess your data, map the opportunities, and hand you a strategy you can act on. With or without us.
A Fresh Perspective
No assumptions. No agenda. Just a clear look at what your data could do.
Intelligence Blueprint
Every source, every gap, every opportunity in your data. Documented and delivered.
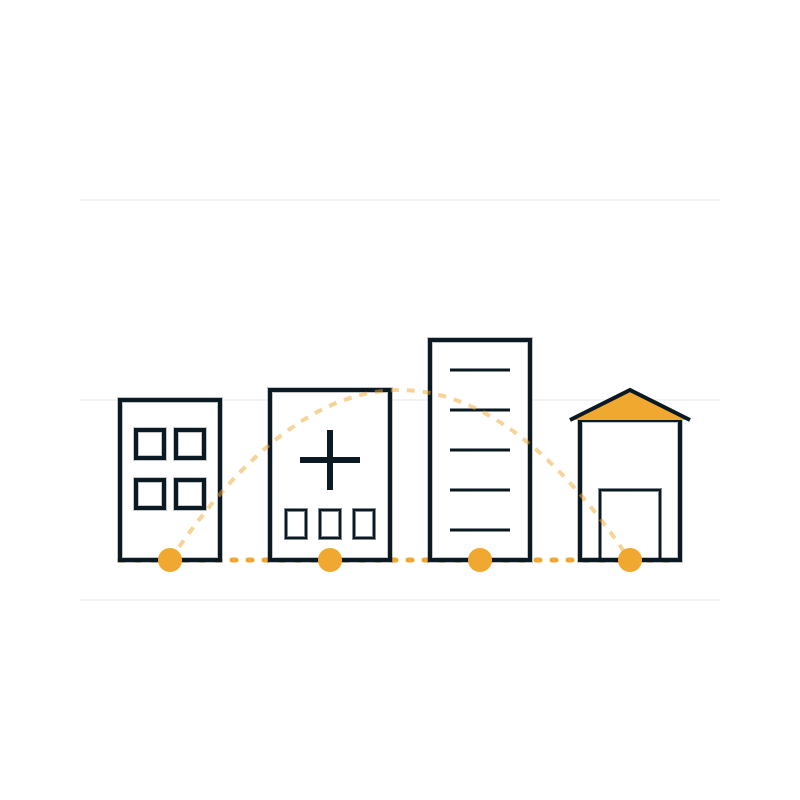
Proven Across Industries
The business changes. Our ability to find what matters in your data doesn’t.
Opportunities Mapped
Not just what you have. What it could unlock for your business.
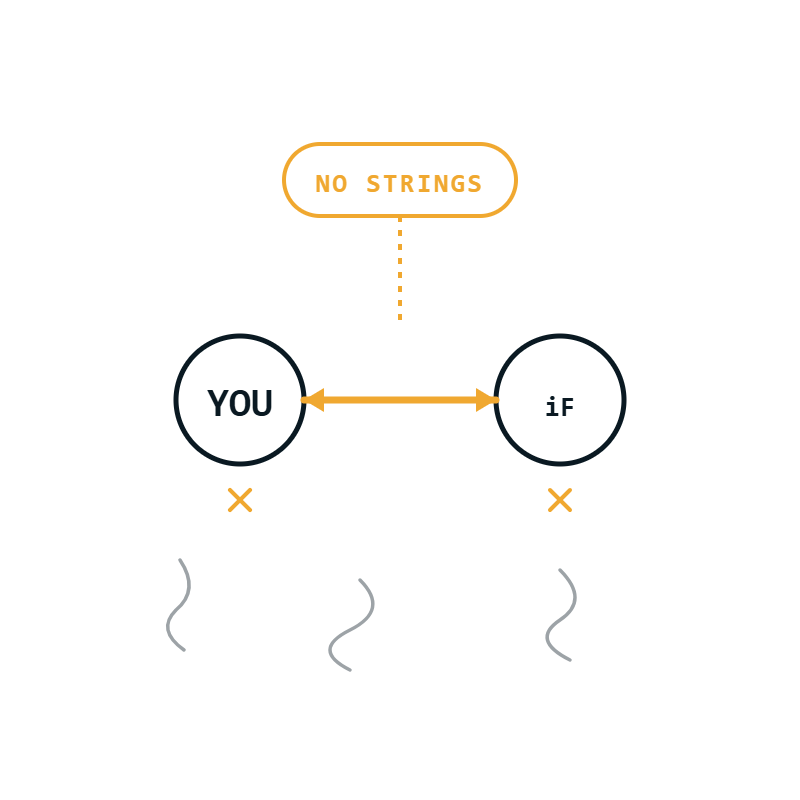
No Strings Attached
Real value delivered whether you become a client or not.
LET’S TALK
Not a sales pitch. Not a canned demo. Just a straight conversation about what you’re working with and whether we can help.